
Student Achievement
2024–2025 Achievements
As we continuously measure our success and evaluate our opportunities for improvement, we are moving forward to become the university of choice for everyone who is seeking higher education in the East Texas region and beyond. Explore our university's facts and stats to find out who we are and how we are doing!
Campus Facts 2024–2025
.
140+
Degree Programs
/
17:1
Student-to-faculty ratio
/
23
Median Class size
Quality

U.S. News and World Report's 2025 university rankings reveal that East Texas A&M rises to the top among state and national universities. Among ranked schools, East Texas A&M was named:
- 25th in the nation for Best Online Bachelor’s Program
- 27th in the nation for Best Online Graduate Criminal Justice Program
- 66th in the nation for Best Online Graduate Business Programs (excluding MBA)
- 85th in the nation for Best Online Master’s in Education Program
- 98th (tie) in nearly 400 national schools for Top Performers on Social Mobility National Universities
- 100th in the nation for Best Online MBA Program
- 131st in the nation for Best Undergraduate Engineering Programs (where doctorate is not offered)
- 172nd in the nation for Best Schools for Social Work
- 182nd in the nation for Best Education Schools
Affordability
East Texas A&M is one of the region’s most affordable universities.
Tuition Per Year
TEXAS RESIDENT: $25,156
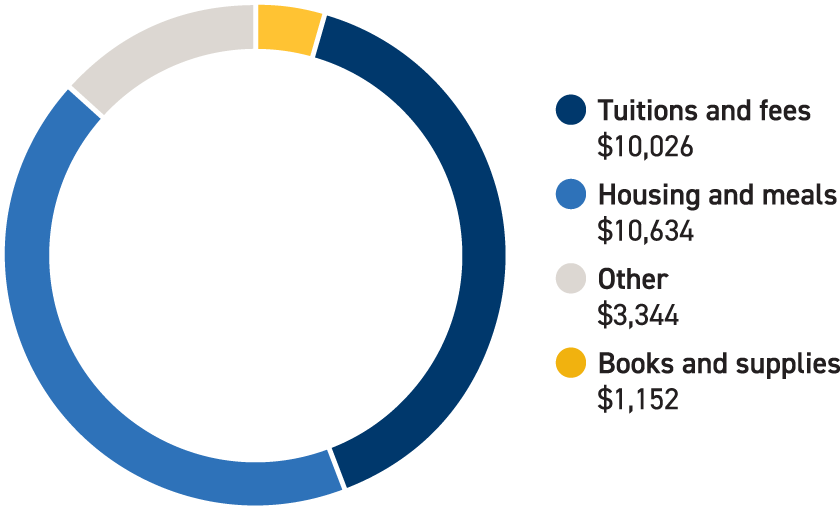
| Tuitions and Fees | Housing and Meals | Books and Supplies | Other |
|---|---|---|---|
| $10,026 | $10,634 | $1,152 | $3,344 |
NON-RESIDENT: $37,456
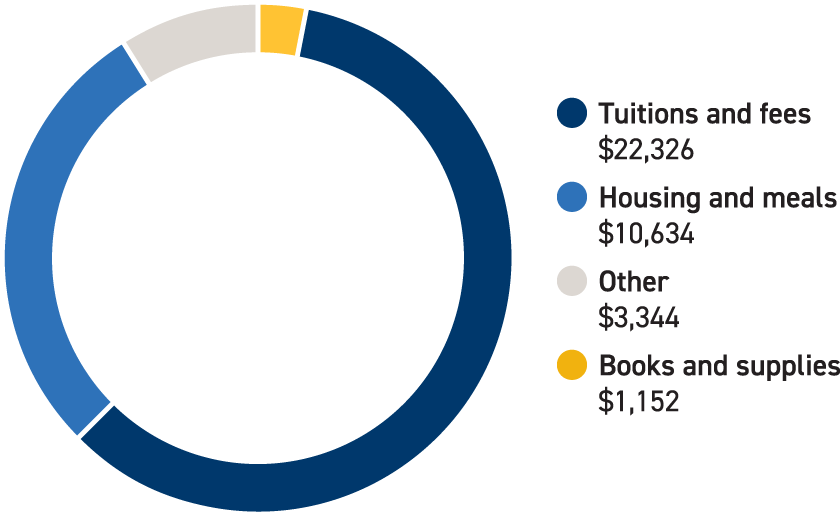
| Tuitions and Fees | Housing and Meals | Books and Supplies | Other |
|---|---|---|---|
| $22,326 | $10,634 | $1,152 | $3,344 |
Price Comparison per Year
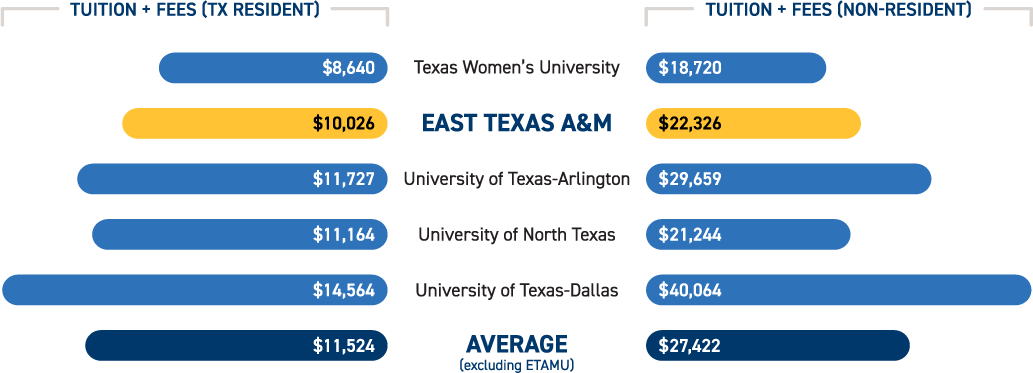
| University | Tuition and Fees (Texas Resident) | Tuition and Fees (Non-Resident) |
|---|---|---|
| Texas Women’s University | $8,640 | $18,720 |
| East Texas A&M University | $10,026 | $22,326 |
| University of Texas-Arlington | $11,727 | $29,659 |
| University of North Texas | $11,164 | $21,244 |
| University of Texas-Dallas | $14,564 | $40,064 |
| Average (excluding ETAMU) | $11,524 | $27,422 |
Highlights

Low tuition cost

Affordable room and board

Great financial aid opportunities

Students graduate with lower debt amount and rate
Accessibility
To meet the needs of today’s busy students, East Texas A&M offers classes in a variety of accessible formats, including:
- More than 35 100% online degree programs
- More than 60 hybrid/blended online degree programs
- Five off-site locations (see map below)
- East Texas A&M University–Dallas — Dallas, TX
- Mesquite Metroplex Center — Mesquite, TX
- Collin Higher Education Center — McKinney, TX
- Navarro Partnership — Corsicana, TX
- RELLIS Academic Alliance — Bryan, TX
Gender
Male students represent 39% of the student body.
Female students represent 61% of the student body.
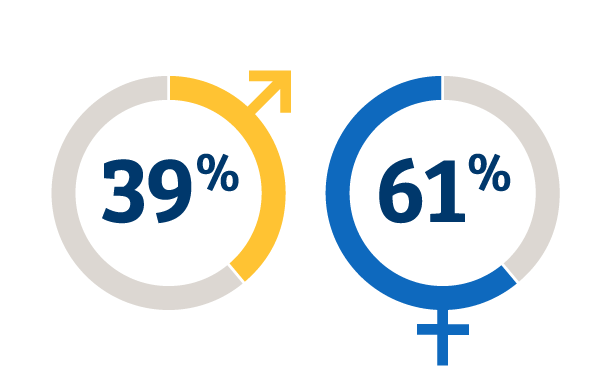
| Gender | Percentage |
|---|---|
| Male | 39% |
| Female | 61% |
Ethnicity
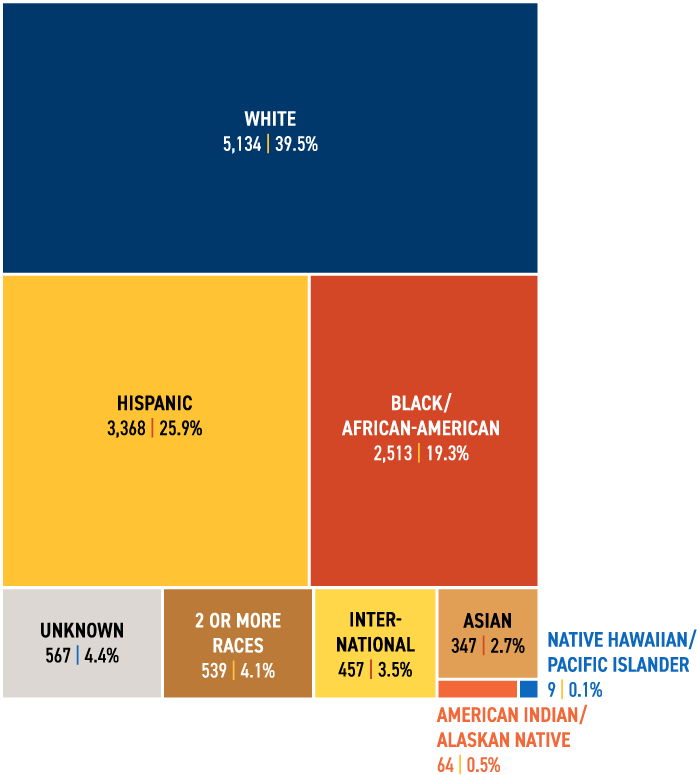
East Texas A&M is committed to fostering a welcoming environment where all are respected. The following chart shows student enrollment by ethnicity in Fall 2025.
| Ethnicity | Headcount | Percentage |
|---|---|---|
| White | 5,134 | 39.5% |
| Hispanic | 3,368 | 25.9% |
| Black/African-American | 2,513 | 19.3% |
| Unknown | 567 | 4.4% |
| International | 457 | 3.5% |
| 2 or More Races | 539 | 4.1% |
| Asian | 347 | 2.7% |
| American Indian/ Alaskan Native | 64 | 0.5% |
| Native Hawaiian/ Pacific Islander | 9 | 0.1% |
Highlights
- East Texas A&M provides excellent programs to attract students from a variety of backgrounds.
- 60% of students identified with racial/ethnical backgrounds other than White, including Hispanic (25.9%), Black or African American (19.3%), and other underrepresented groups.

Employability
East Texas A&M keeps its thumb on the pulse of industry needs to provide a relevant education that prepares students to compete for the best jobs on the market.
The 2025 Graduate Exit Survey demonstrates exceptional preparation across all job-ready competencies, with 95%+ of graduating seniors rating their marketable skills as good to excellent:
| THECB 60X30 Strategic Plan Marketable Skills | % of Students Rated Good to Excellent in how the university prepared them |
| Critical Thinking/ Problem Solving | 97.4% |
| Communication | 97.3% |
| Career and Self-Development | 94.9% |
| Promoting a Welcoming Culture | 96.3% |
| Teamwork/Collaboration | 97.5% |
| Digital Technology | 95.4% |
| Leadership | 96.0% |
| Professionalism/Work Ethic | 97.7% |
Highlights
East Texas A&M demonstrates a clear and effective pathway from education to employment. The university’s comprehensive approach to developing marketable skills across all core competencies directly supports graduates’ ability to secure employment quickly after degree completion. According to the East Texas A&M 2025 Alumni Survey for one year out alumni: 89% students were employed within 12 months of receiving their degrees.
Social Mobility
In 2025 Spring Alumni Survey, after five years after graduation, alumni report strong upward socioeconomic mobility. While most came from average or below-average socioeconomic backgrounds, a majority now place themselves above average. Compared to their family's standing when they began college, far fewer alumni place themselves in the lowest categories (a drop from 16% to 3%).The proportion rating themselves in far above average alone increased from 3% to 14%. Overall distributional changes show a movement away from below-average backgrounds and toward higher perceived standing.
Highlights
- East Texas A&M promotes social mobility by offering affordable tuition, admitting economically disadvantaged students and providing quality academic programs that prepare students to compete in the job market.
- East Texas A&M is ranked 98th in the nation for Top Performers on Social Mobility National Universities and is one of only 28 Texas national universities ranked as a top performer on social mobility.
Outcomes Measures for Student Achievement
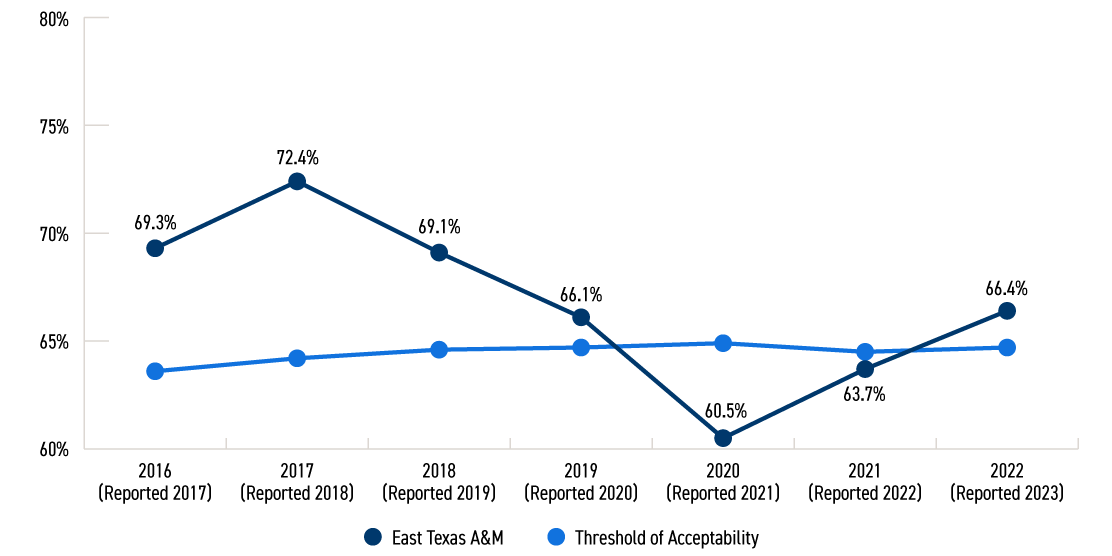
| Year | Threshold of Acceptability | East Texas A&M |
|---|---|---|
| 2016 (Reported 2017) | 63.6% | 69.3% |
| 2017 (Reported 2018) | 64.2% | 72.4% |
| 2018 (Reported 2019) | 64.6% | 69.1% |
| 2019 (Reported 2020) | 64.7% | 66.1% |
| 2020 (Reported 2021) | 64.9% | 60.5% |
| 2021 (Reported 2022) | 64.5% | 63.7% |
| 2022 (Reported 2023) | 64.7% | 66.4% |
1-Year Retention Rate by Cohort Year
After pandemic-related challenges that impacted the 2020 cohort, East Texas A&M has demonstrated strong recovery with retention rates for first time full time students seeking bachelor’s degrees returning above the acceptability threshold at 66.4% for the most recent cohort.
Threshold of Acceptability: The average retention rates of 8 system regional universities from past five years
Source: EmpowerU
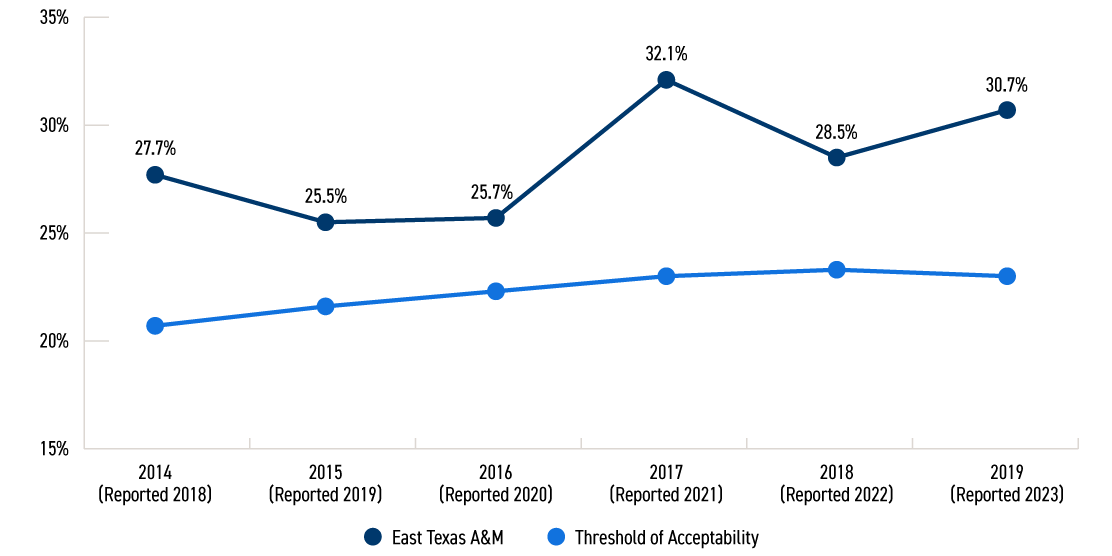
| Year | Threshold of Acceptability | East Texas A&M |
|---|---|---|
| 2014 (Reported 2018) | 19.8% | 27.7% |
| 2015 (Reported 2019) | 20.7% | 25.5% |
| 2016 (Reported 2020) | 21.6% | 25.7% |
| 2017 (Reported 2021) | 22.3% | 32.1% |
| 2018 (Reported 2022) | 23.0% | 28.5% |
| 2019 (Reported 2023) | 23.3% | 30.7% |
4-Year Graduation Rate by Cohort Year
Four-year graduation rates for first-time full-time student seeking bachelor's degrees have improved from 25.5% to 30.7% over recent cohorts, with East Texas A&M consistently performing above the acceptability threshold. The university achieved its highest 4-year graduation rate of 32.1% with the 2017 cohort and has maintained rates near 30% in recent years.
Source: EmpowerU
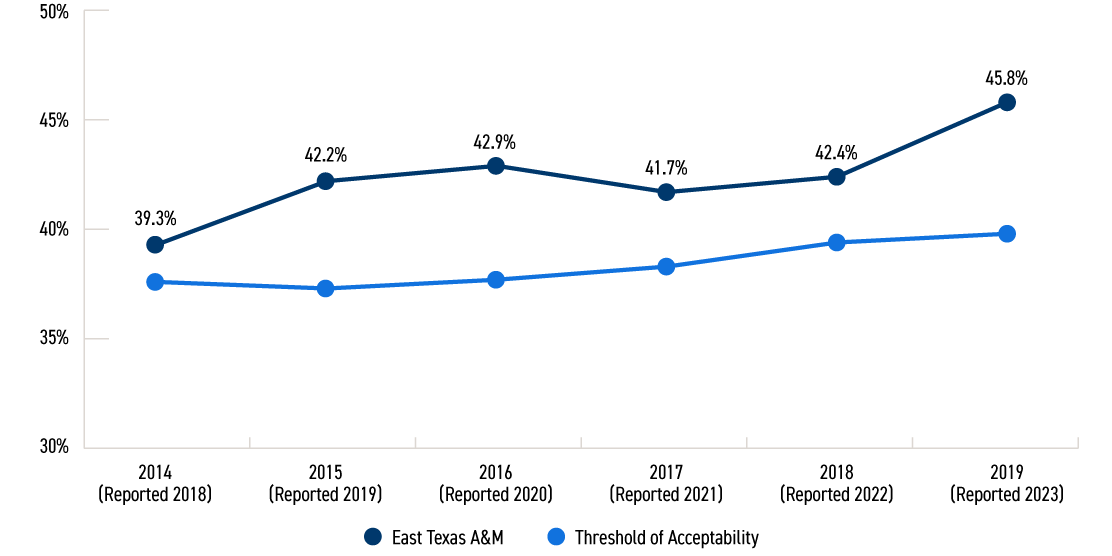
| Year | Threshold of Acceptability | East Texas A&M |
|---|---|---|
| 2012 (Reported 2018) | 37.6% | 39.3% |
| 2013 (Reported 2019) | 37.3% | 42.2% |
| 2014 (Reported 2020) | 37.7% | 42.9% |
| 2015 (Reported 2021) | 38.3% | 41.7% |
| 2016 (Reported 2022) | 39.4% | 42.4% |
| 2017 (Reported 2023) | 39.8% | 45.8% |
6-Year Graduation Rate by Cohort Year
Both THECB certified data and IPEDS report showed East Texas A&M’s 6-year graduation rates consistently range between 42-46%, exceeding both state and federal accountability thresholds. The university achieved its strongest performance with the 2017 cohort (45.8% in THECB data, 46% in IPEDS), demonstrating sustained improvement from earlier cohorts and meeting accountability standards across both reporting systems.
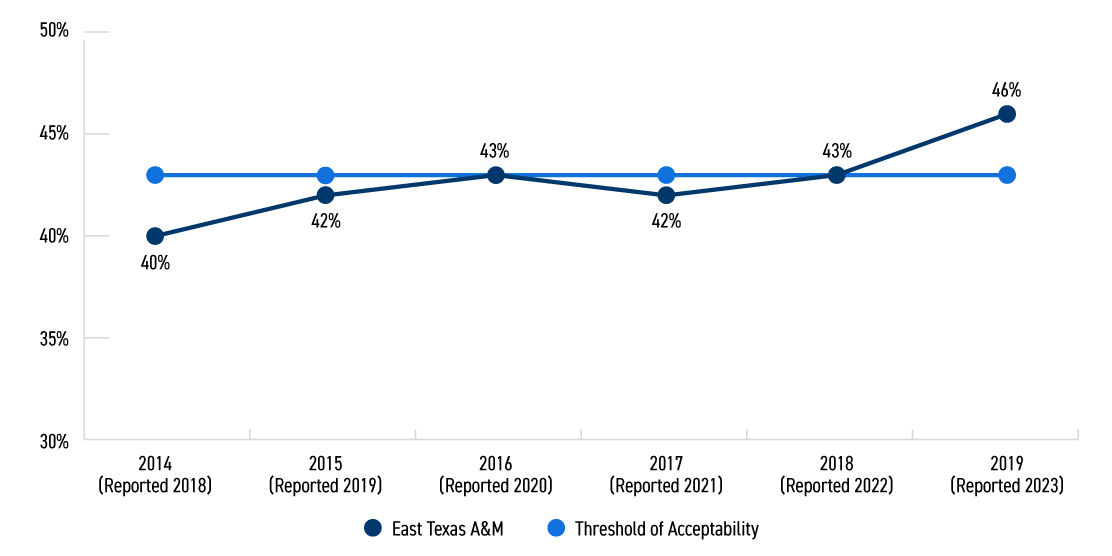
| Year | Threshold of Acceptability | East Texas A&M |
|---|---|---|
| 2012 (Reported 2019) | 43% | 40% |
| 2013 (Reported 2020) | 43% | 42% |
| 2014 (Reported 2021) | 43% | 43% |
| 2015 (Reported 2022) | 43% | 42% |
| 2016 (Reported 2023) | 43% | 43% |
| 2017 (Reported 2024) | 43% | 46% |
6-Year Graduation Rate by Cohort Year (IPEDS)
The percentage of first-time, full-time students seeking bachelor’s degrees who graduated from East Texas A&M within six years.
Note: Threshold of Acceptability required by SACSCOC at 2010 Cohort baseline of 43%
Transfer Graduation Rate
Transfer students maintain 6-year graduation rates above 63%, with most cohorts achieving 65-66%, reflecting East Texas A&M’s continuous supporting transfer students through degree completion.
Transfer students at East Texas A&M achieve graduation rates 20+ percentage points higher than first-time students at both the 4-year and 6-year marks, demonstrating the university’s strong support systems and pathways for students transferring from community colleges and other institutions.
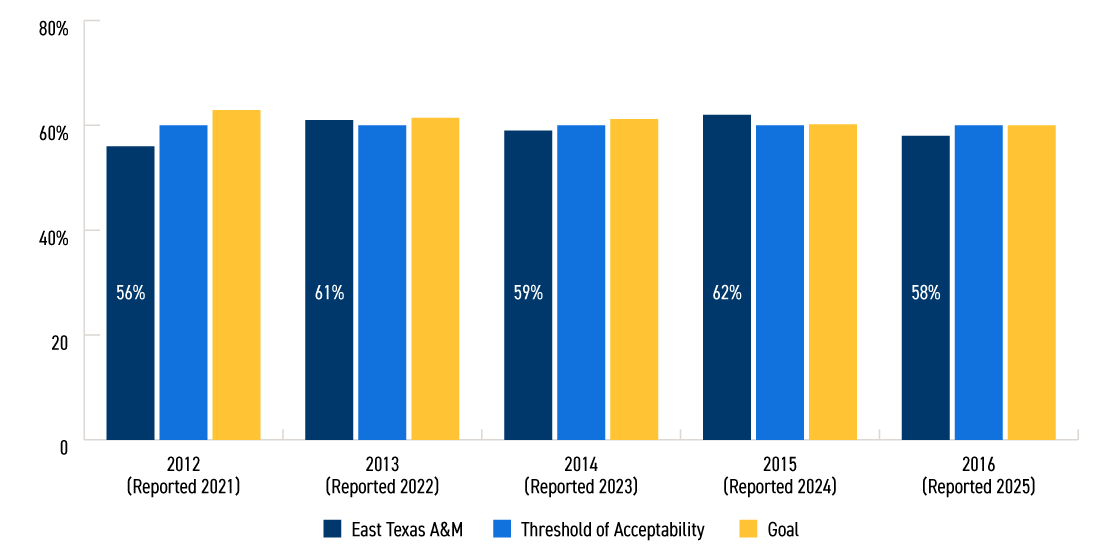
| Year | Goal | Threshold of Acceptability | East Texas A&M |
|---|---|---|---|
| 2012 (Reported 2021) | 62.8667% | 60% | 56% |
| 2013 (Reported 2022) | 61.37% | 60% | 61% |
| 2014 (Reported 2023) | 61.22% | 60% | 59% |
| 2015 (Reported 2024) | 60.18% | 60% | 62% |
| 2016 (Reported 2025) | 60.74% | 60% | 58% |
4-Year Non-First-Time Entering (Transfer) Graduation Rate
The percentage of full-time non-first-time-entering students by cohort year who pursued bachelor's degrees and who graduated from East Texas A&M within 4 years (as reported by IPEDS).
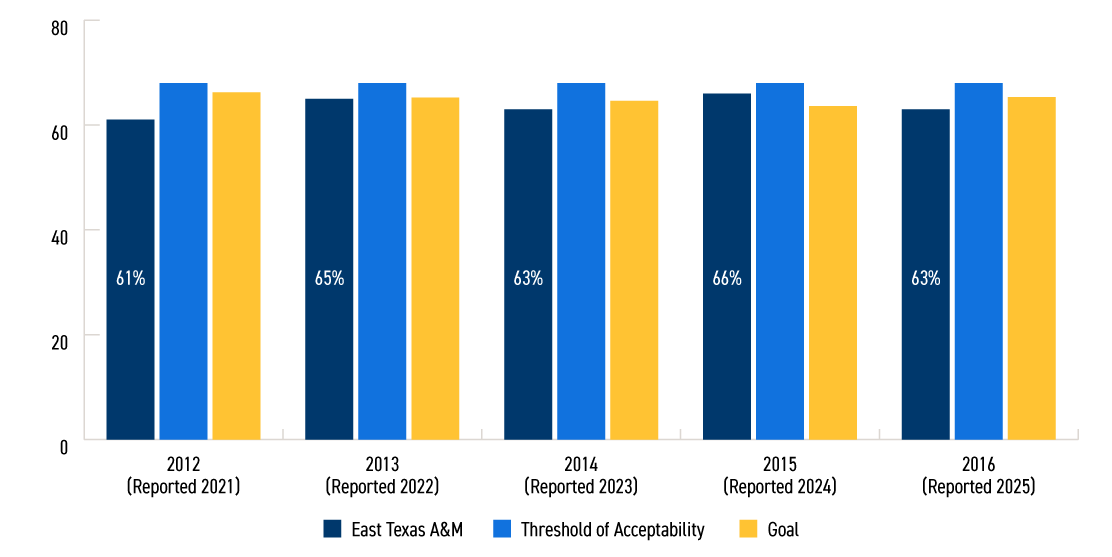
| Year | Goal | Threshold of Acceptability | East Texas A&M |
|---|---|---|---|
| 2012 (Reported 2021) | 66.2% | 68% | 61% |
| 2013 (Reported 2022) | 65.2% | 68% | 65% |
| 2014 (Reported 2023) | 64.6% | 68% | 63% |
| 2015 (Reported 2024) | 63.6% | 68% | 66% |
| 2016 (Reported 2025) | 65.3% | 68% | 63% |
6-Year Non-First-Time Entering (Transfer) Graduation Rate
The percentage of full-time non-first-time-entering students by cohort year who pursued bachelor's degrees and who graduated from East Texas A&M within 6 years (as reported by IPEDS).
Student Economics and Outcomes
The Texas Higher Education Coordinating Board's (THECB) 60x30TX strategic plan includes a goal that by 2030, 60% of Texans aged 25 to 34 will have either a certificate or degree (credential). Those credentials would impart “identifiable marketable skills” to graduates. The THECB tracks post-graduation outcomes within one year of the award of a credential. Institutions track students and report the percentage of those working, enrolled, or working and enrolled within a year of completion.
| Year | Goal (5% Growth) | Threshold of Acceptability | East Texas A&M |
|---|---|---|---|
| 2018 | 1193 | 1021 | 1132 |
| 2019 | 1189 | 1043 | 1111 |
| 2020 | 1167 | 1082 | 1126 |
| 2021 | 1182 | 1116 | 1225 |
| 2022 | 1286 | 1146 | 1112 |
| 2023 | 1168 | 1141 | 1098 |
| 2024 | 1153 | 1134 | 1115 |
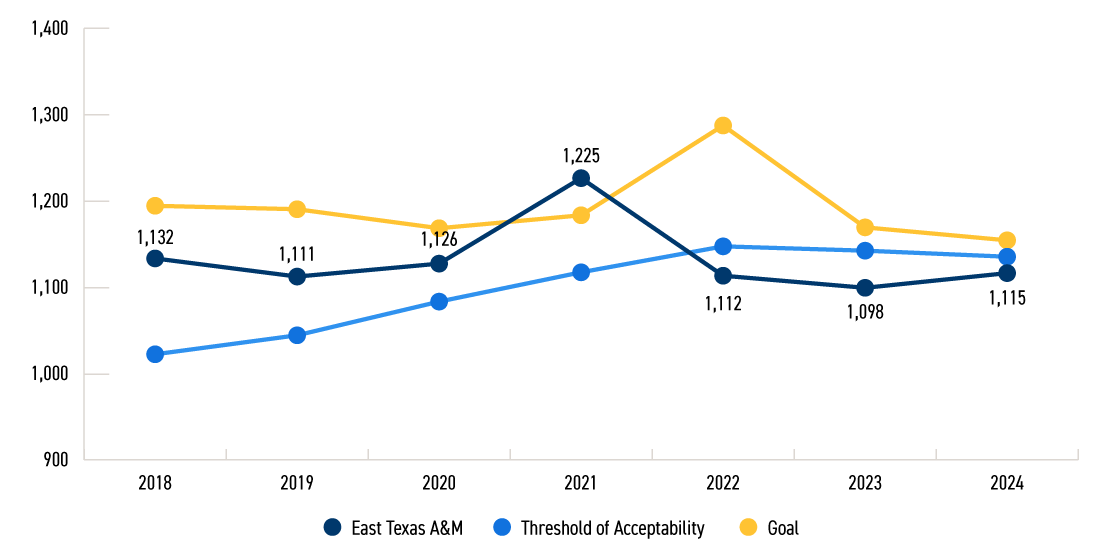
Completions by Economically Disadvantaged Students
East Texas A&M increased bachelor’s degrees awarded to economically disadvantaged students from 1,111 (2019) to a peak of 1,225 (2021), representing 8.9% growth above the five-year average. Since 2021, graduation numbers have stabilized around 1,100 annually, reflecting broader enrollment patterns following the pandemic period. The university continues to meet accountability thresholds and remains committed to supporting Pell-eligible students through degree completion, with 1,115 economically disadvantaged students earning bachelor’s degrees in 2024.
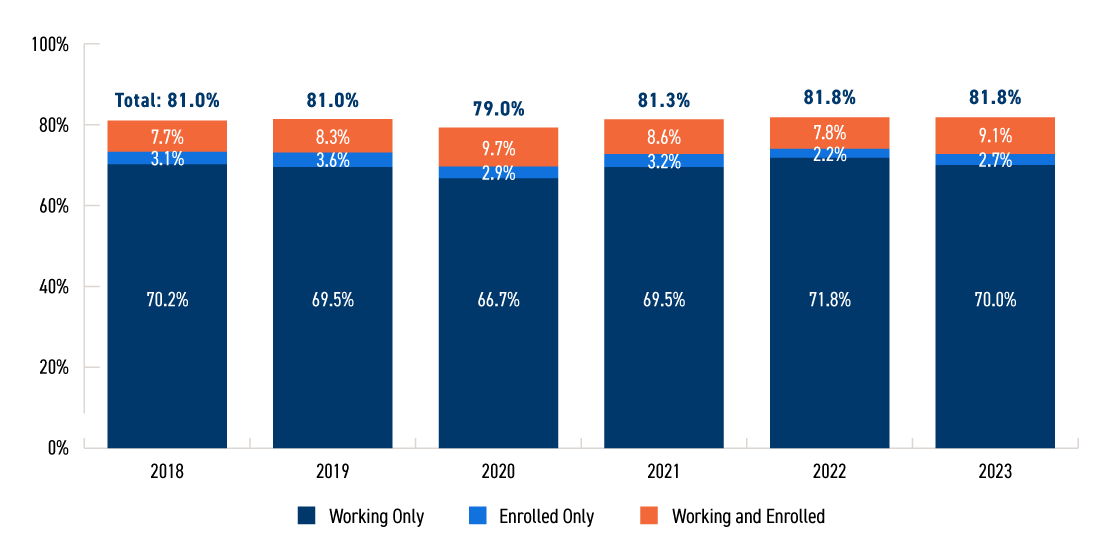
| Year | Working Only | Enrolled Only | Working and Enrolled |
|---|---|---|---|
| 2018 | 70.2% | 3.1% | 7.7% |
| 2019 | 69.5% | 3.6% | 8.3% |
| 2020 | 66.7% | 2.9% | 9.7% |
| 2021 | 69.5% | 3.2% | 8.6% |
| 2022 | 71.8% | 2.2% | 7.8% |
| 2023 | 70% | 2.7% | 9.1% |
Percentage of Graduates Working or Enrolled
The percentage of students awarded a degree in a given year who are employed in the fourth quarter of the calendar year in which the program (fiscal year) ends or enrolled in a Texas public or private institution in the fall semester after receiving the award.
Since 2021, approximately 82% of East Texas A&M graduates maintained working within the state of Texas and/or enrolled in a Texas public or private college.
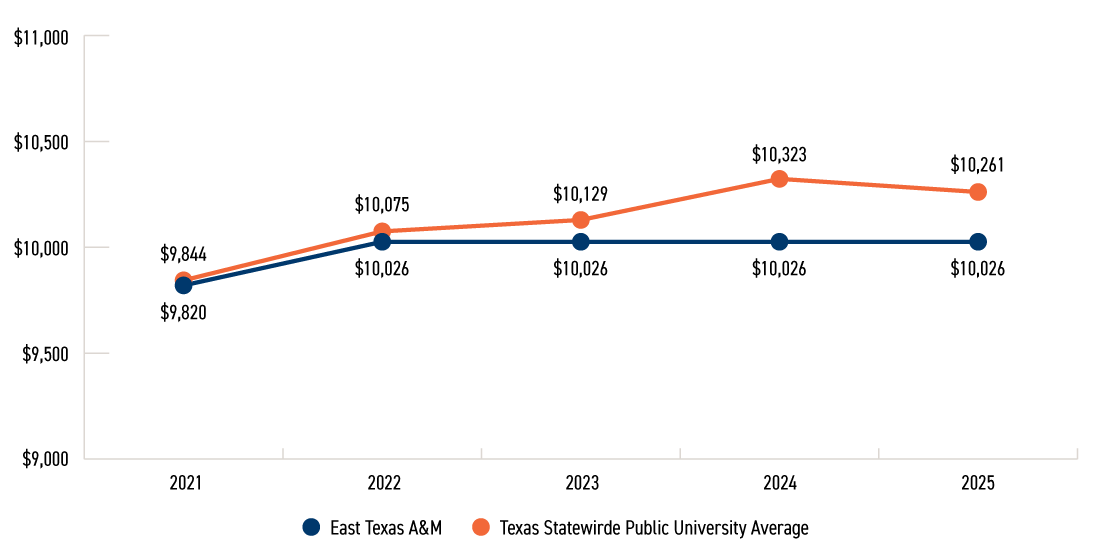
| Year | East Texas A&M | Texas Statewide Public University Average |
|---|---|---|
| 2021 | $9820 | $9844 |
| 2022 | $10026 | $10075 |
| 2023 | $10026 | $10129 |
| 2024 | $10026 | $10323 |
| 2025 | $10026 | $10261 |
Tuition and Fees Cost (30 SCH)
The average cost of mandatory tuition and fees charged a student taking 30 semester credit hours.
East Texas A&M is committed to remaining affordable and seeks to rein in student costs but also attend to the relative value of a student's degree versus those costs. East Texas A&M's tuition and fees are significantly below the median tuition and fees for the university's state public peer institutions, as defined by the THECB.